August 1st, 2019
July property market update (2019)
Industry News
Industry News
Last month, the national vacancy rate dropped to 2.1%, property listings fell 6.3%, Finder released 51 suburbs where rents dropped more than 20% and there are now over 1 million unemployed Australians.
For the week ending 25 August 2020, the national asking price rose 0.3% for houses and 0.4% for units, compared to the week prior. Across capital cities, property prices increased by 0.1% for houses and declined by 1.6% for units.
Month on month, the national asking price decreased by 1% for houses and increased by 0.1% for units. Sydney and Brisbane recorded an overall decline while other capital cities recorded mixed results.
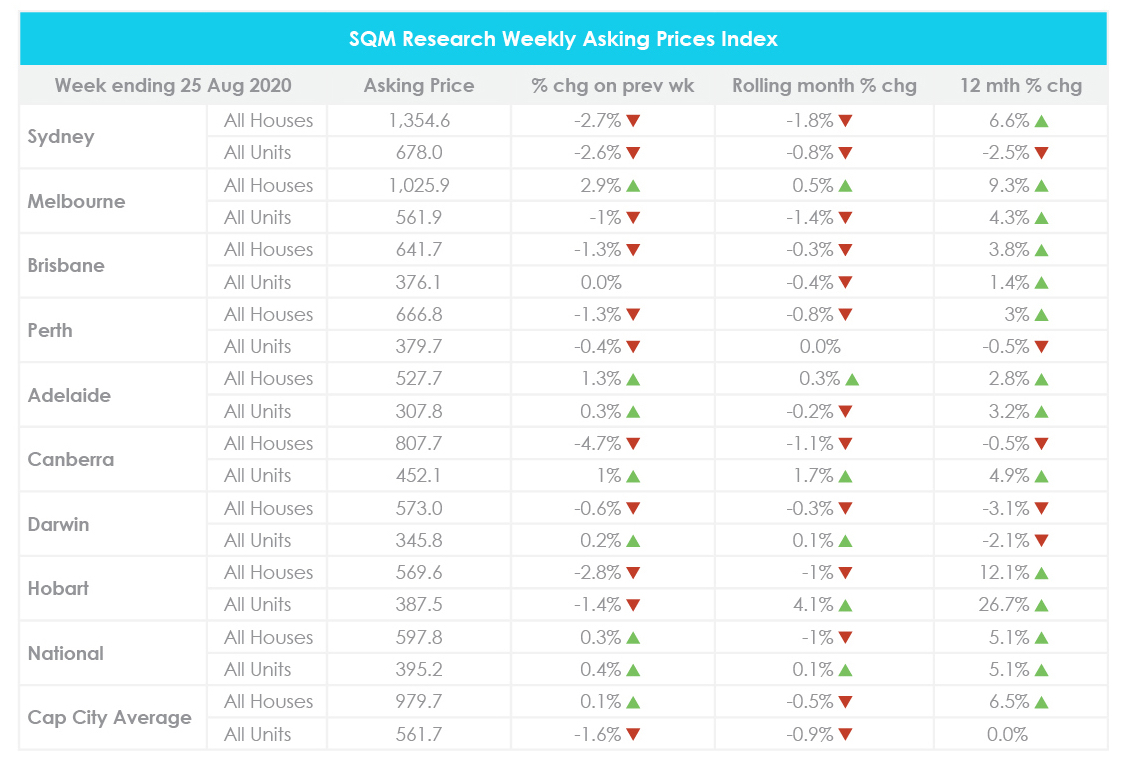
Compared to 12 months ago, this reflects a 5.1% increase in both house and unit prices nationwide. Across capital cities, this reflects a 6.5% increase in house prices and no change in unit prices. Further price breakdowns can be found here.
According to SQM Research, national residential property listings decreased by 6.3% from 312,680 listings in July to 293,053 listings in August. While all capital cities recorded declines, Melbourne led the pack with a 13.2% decrease over the month. This was followed by Hobart at 9.4% then Canberra at 6.3%.
Year on year, property listings are down 10%. All capital cities recorded a decrease with the exception of Sydney where stock increased by 1.2%. Darwin and Hobart recorded the most significant declines compared to the year prior, at 26.9% and 21.4% respectively.
SQM Research Managing Director Louis Christopher said, “There was quite a large drop in new listings for the month, predominantly driven by the shortfall in Melbourne. The Melbourne numbers are quite revealing actually. It is reflective of the near entire freeze-up of the Melbourne housing market. As the Victorian State Government is heavily reliant on property stamp duty revenues, there must be a significant State revenue collapse occurring.”
“Elsewhere we continue to record falling supply in Australia’s regional areas. Our take on that phenomenon is that demand has boomed for regional real estate as more of our populations look to remote living.”
For the week ending 28 August 2020, the average weekly rent across Australia held steady at $459 for houses and decreased by 3% to $372 for units, compared to the week prior.
Across capital cities, Canberra recorded the highest average weekly rent for houses at $639.60 and for units at $470.80. In contrast, Adelaide recorded the lowest weekly rent for houses at $408.30 and for units at $315.40.
Month on month, the national weekly rent rose 0.9% for houses and 1.4% for units. Sydney, Melbourne, Adelaide and Brisbane recorded overall declines in weekly rents while Perth recorded an overall increase.
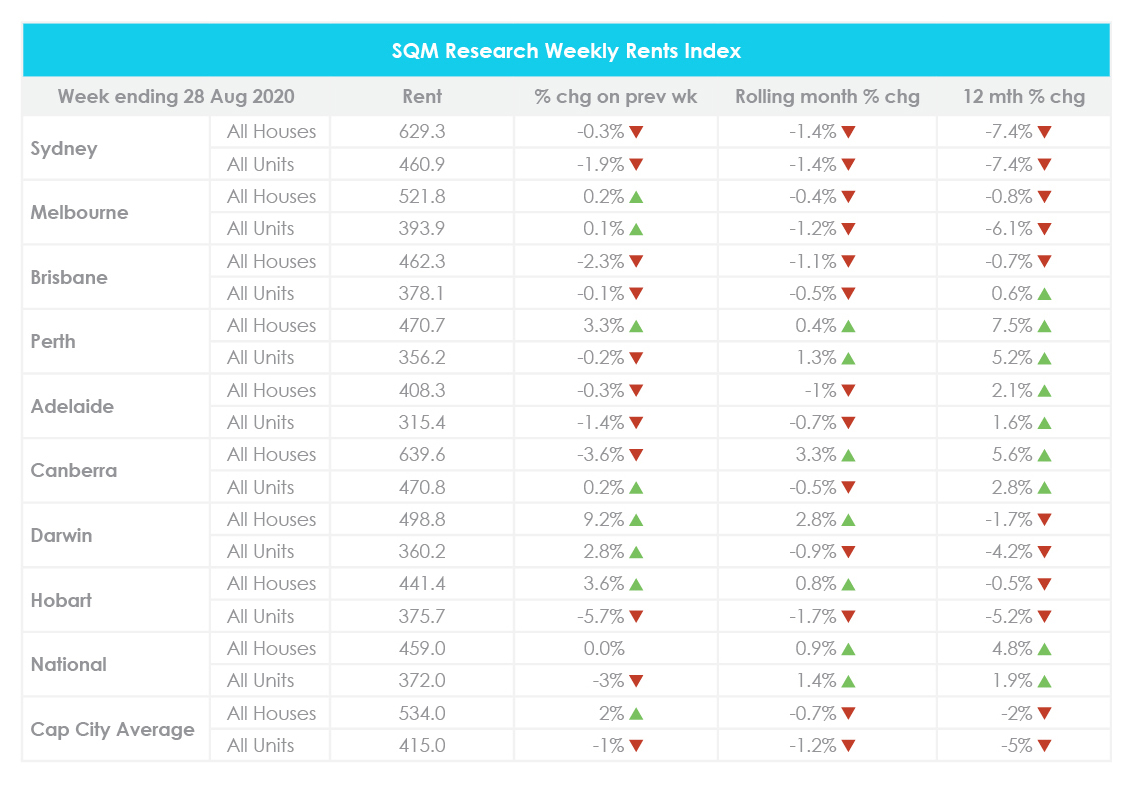
Compared to a year ago, national weekly rents have increased by 4.8% for houses and by 1.9% for units. Meanwhile, capital city weekly rents have decreased by 2% for houses and by 5% for units. Further price breakdowns can be found here.
Finder revealed the 51 suburbs in Australia where the median advertised rent has dropped by more than 20% in the 12 months between April 2019 and May 2020. Apartments showed the biggest drop, with New South Wales and Victoria leading the decline. The 51 suburbs are:
The national vacancy rate decreased from 2.2% in June to 2.1% in July with 71,760 vacant residential properties Australia-wide. All capital cities recorded a decrease in vacancy rates compared to the month prior, with the exception of Melbourne which recorded an increase of 0.1%.
Sydney recorded the highest vacancy rate nationwide at 3.6% while Hobart recorded the lowest vacancy rate nationwide at 0.7%.
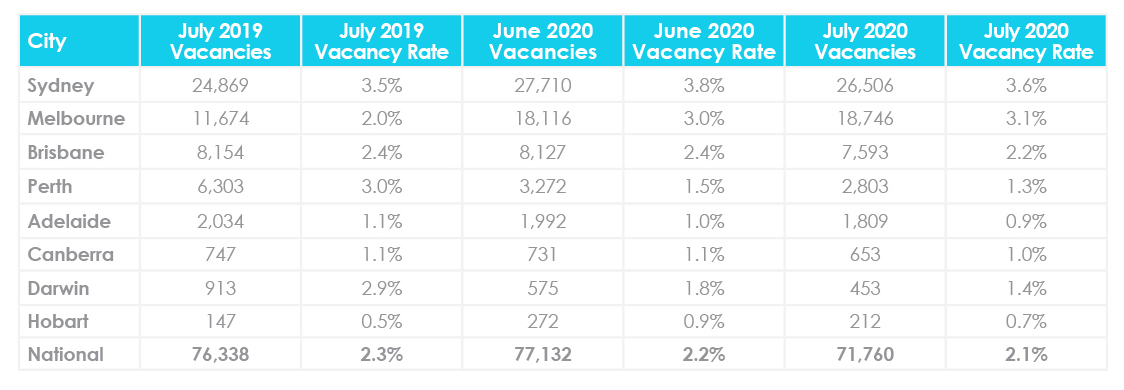
Year on year, the national vacancy rate is 0.2% lower. Compared to the year prior, Sydney, Melbourne and Hobart recorded higher vacancy rates while Brisbane, Darwin, Canberra, Adelaide and Perth recorded lower vacancy rates. Further vacancy rate breakdowns can be found here.
Some CBD vacancy rates continued to improve from record highs. Sydney CBD’s vacancy rate decreased from 13.8% in June to 13.2% in July, Brisbane CBD’s vacancy rate decreased from 14% to 13% and Melbourne CBD’s vacancy rate held steady at 8.8%. Conversely, Adelaide CBD’s vacancy rate increased from 7.1% in June to 7.6% in July and Perth CBD’s vacancy rate rose from 5.3% to 5.5%.
SQM Research Managing Director Louis Christopher said, “Rental vacancy rates for most capital cities recorded a decline over the course of July. We are now observing a clear trend of reduced rental vacancies in outer suburban locations and regional locations around Australia. However, when looking into the numbers it is clear there are still very elevated levels of rental vacancies in the inner-city locations.”
“We believe there has been a move towards outer regional living and away from high density areas. This very likely has been as a result of fears surrounding coronavirus and the ability for many employees (particularly in the corporate sector) to work remotely.”
For the week ending 23 August 2020, there were 1,064 homes taken to auction across capital cities with a final clearance rate of 60%. This is a slight improvement on the previous week when 1,046 homes were taken to auction with a final clearance rate of 58.4%. However, for the same period last year, 1,415 homes were taken to auction with a final clearance rate of 74.2%.
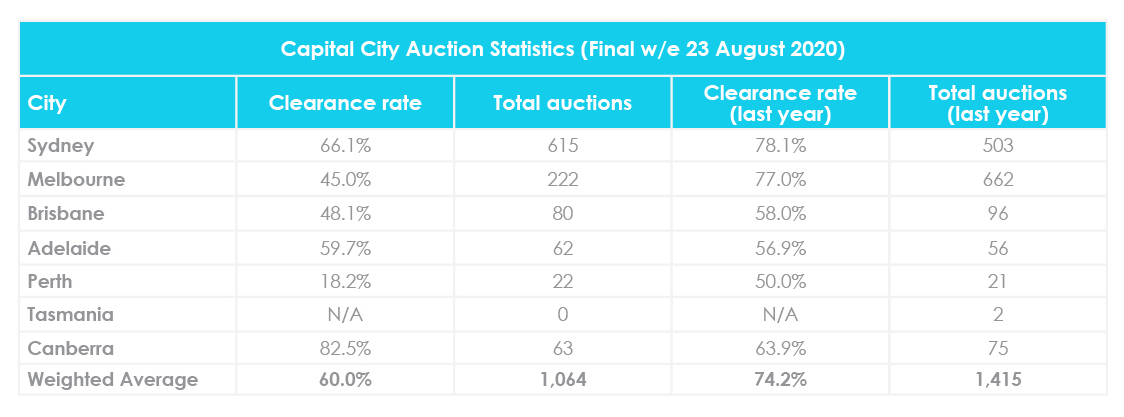
Across capital cities, Canberra recorded the highest clearance rate at 82.5%. Notably, this is the third time that Canberra has recorded a clearance rate above 80% over the past six weeks.
Sydney recorded the second-highest clearance rate at 66.1%, followed by Adelaide at 59.7%, Brisbane at 48.1% and Melbourne at 45%. With Melbourne in lockdown, fewer homes were taken to auction as the number of properties sold prior to the scheduled auction date increased considerably and the withdrawal rate increased to 41%.
In contrast, Perth recorded the lowest clearance rate at 18.2%. For further auction clearance rate information across each capital city, click here.
The RBA kept the cash rate unchanged at 0.25% as “the downturn is not as severe as earlier expected and a recovery is now underway in most of Australia.” However, with the coronavirus outbreak in Victoria, the Board considered a number of scenarios during its recent meeting.
RBA Governor Philip Lowe said, “In the baseline scenario, output falls by 6% over 2020 and then grows by 5% over the following year. In this scenario, the unemployment rate rises to around 10% later in 2020 due to further job losses in Victoria and more people elsewhere in Australia looking for jobs. Over the following couple of years, the unemployment rate is expected to decline gradually to around 7%.”
“A stronger recovery is possible if progress is made in containing the virus in the near future. This progress would support an improvement in confidence and a less cautious approach by households and businesses to their spending.”
“On the other hand, if Australia and other countries were to experience further widespread lockdowns, the recovery in both output and the labour market would be delayed.”
According to the latest CoreLogic Home Value Index which shows the cumulative dwelling market value change from the onset of the COVID-19 pandemic, Melbourne property prices have dropped 3.5% while ACT property prices have increased by 1.3%.
CoreLogic Head of Research Australia Eliza Owen said that there are cyclical and structural reasons for Melbourne’s steep decline in dwelling values since March.
“Cyclically, Melbourne property is subject to more volatile growth rates, and is also presenting strong declines off the back of very high growth rates through the previous upswing. Structurally, there has been an enormous demand shock to the Melbourne property market with the closure of international borders, where Melbourne previously had the highest level of net overseas migration of the capital city markets.”
Meanwhile, Perth has seen a 2% decrease, Sydney has seen a 1.7% decrease, Brisbane values have dropped 0.6% while Darwin property prices have remained unchanged.
On the other hand, ACT, Hobart and Adelaide have seen increases in dwelling values due to the easing of monetary policy. The cash rate was reduced to a thirty year low of 0.25% in March, where it has remained since. RBA research shows that typically when the cash rate is reduced, property values will increase as a result of cheaper debt and greater purchasing capacity.
As a result, major banks and non-bank lenders have slashed variable and fixed home loan rates to record lows over the past few months in a bid for new customers. This has helped support housing demand and insulate housing values since the start of the pandemic.
The most recent Australian Bureau of Statistics (ABS) labour force figures show that over 1 million Australians are now unemployed, bringing the unemployment rate to 7.5% in July. However, it is worth noting that the survey was completed prior to Victoria implementing stage four lockdown restrictions, so the current figures could be higher.
The unemployment rate has been trending upwards since the onset of the pandemic in March. It jumped from 5.2% in March to 6.4% in April, then 7.1% in May, then 7.4% in June. The 7.5% unemployment rate is now more than two points higher than it was in July 2019 and the RBA expects this figure to increase to 10% in the June quarter.
At the same time, the participation rate increased by 0.6% to 64.7% and the number of employed people increased by 0.9% to almost 12.5 million people. New South Wales recorded the largest increase in employment (up 56,800 people), followed by Victoria (up 22,900 people) and Western Australia (up 19,100 people).
Moreover, the monthly hours worked in all jobs increased by 1.3% to 1,681.3 million hours. While this is an improvement on the low point recorded in May, it is still 5.5% lower than the hours worked in March.
Hopefully you enjoyed this August Property Market Update. Be sure to subscribe to our Monthly Insider below to receive email updates.
You might also be interested in:
Let us know your thoughts on this month’s August property market update by emailing [email protected].