August 28th, 2019
August property market update (2019)
Industry News
Industry News

In September, the cash rate was held at 1% for the second month in a row, vacancy rates declined marginally and preliminary auction clearance rates held strong despite an increase in volumes.
Without further ado, here’s this month’s September property market update:
In September, the national asking price for houses and units fell by 0.2%, compared to the month prior. Across capital cities, the asking price for houses increased by 1.5% and by 0.5% for units. Hobart showed the strongest signs of growth, followed by Sydney and Melbourne.

Year on year, this reflects an increase in property prices nationwide and a decline in property prices across capital cities. Further price breakdowns can be found here.
For the week ending 20 September 2019, the average weekly rent for houses and units increased 0.5% nationwide to $442 and $368 respectively. Meanwhile, the average weekly rent across capital cities rose by 0.2% for houses and fell by 0.7% for units.

Sydney and Melbourne recorded a decline in average weekly rents for houses and units while Brisbane, Canberra and Darwin recorded a slight increase across the board. Overall, national weekly rents are 1.35% higher than they were in September last year and capital city weekly rents are 0.8% lower. Further price breakdowns can be found here.
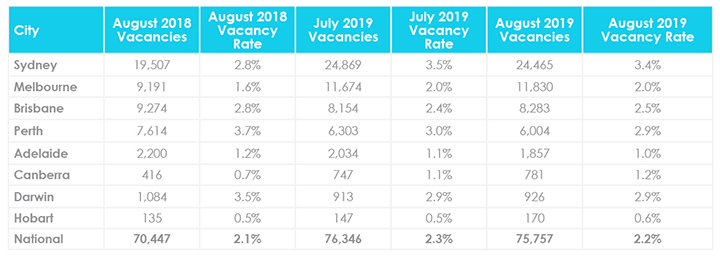
According to SQM Research, the national residential vacancy rate declined marginally from 2.3% in July to 2.2% in August. However, this is still 0.1% higher than the vacancy rate recorded in August last year.
While vacancy rates remained steady in Melbourne and Darwin, Perth, Adelaide and Sydney all recorded a 0.1% decrease. Meanwhile, Canberra, Hobart and Brisbane recorded a 0.1% increase month on month.

Notably, Sydney’s vacancy rate continues to be the highest in the country at 3.4%, up from 2.8% the year prior. In contrast, Hobart continues to maintain the lowest vacancy rate nationwide at 0.6%. Further vacancy rate breakdowns can be found here.
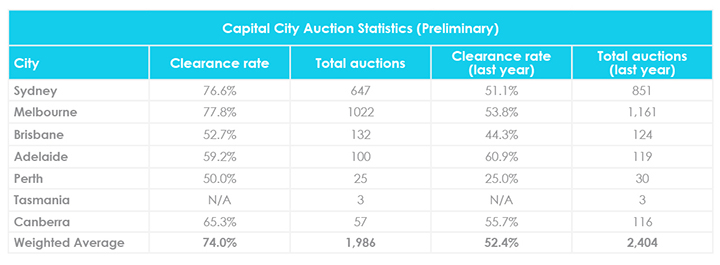
For the week ending 23 September 2019, just under 2,000 homes were taken to auction and 1,161 homes were cleared across combined capital cities, bringing the preliminary auction clearance rate to 74%. Over the same period last year, around 400 more homes were taken to auction, but the auction clearance rate was much lower at 52.4%.
While Melbourne saw a pickup in volume with 1,022 homes scheduled for auction, the city yielded the highest preliminary auction clearance rate across the country at 77.8%. This was followed closely by Sydney’s preliminary auction clearance rate of 76.6%. For further auction clearance rate information across each capital city, click here.

The Reserve Bank of Australia (RBA) decided to keep the cash rate unchanged at 1% for the second month in a row due to economic uncertainty as a result of trade and technology disputes.
In a speech to Armidale Business Chamber in regional New South Wales, RBA Governor Philip Lowe stated that previous rate cuts aimed at reaching the inflation target of 2 to 3% and reducing unemployment to 4.5% had been ineffective to date.
He noted that there had been “no growth at all in consumption per person, which is an unusual outcome at a time when employment is growing strongly” and that “an extended period of low interest rates will be required in Australia to make progress in reducing unemployment and achieving more assured progress towards the inflation target.”
Following the recent release of labour force data indicating a rise in unemployment to a one-year high of 5.3%, all signs are pointing to a further easing of monetary policy. Additionally, experts from the “big four” Australian banks – CBA, NAB, Westpac and ANZ – are predicting a third cash rate cut in October.
A few months ago, the Australian Prudential Regulation Authority (APRA) eased home lending criteria by lifting the 10% cap on investor lending growth, the 30% cap on interest-only loans and the 7% serviceability buffer.
As a result, the value of lending to owner-occupiers has increased 9.3% in the June 2019 quarter, compared to the March 2019 quarter. Meanwhile, the value of lending to investors has increased 13.8% over the same period
Meanwhile, over 3,700 people have accessed their superannuation savings as part of the First Home Super Savers Scheme and the First Home Loan Deposit Scheme is expected to launch shortly. The scheme is designed to ease home loan affordability and will enable up to 10,000 first home buyers per year to purchase a home with a smaller deposit of as little as 5%.
A new style of property ownership that utilises blockchain technology is being trialled in South Australia. Two individual apartments in Adelaide were divided into 20 “bricklets” each, with each bricklet representing a 5% stake in the property.
While investors won’t be able to live in the property, the scheme will entitle investors to a portion of the rental returns and any increase to the property’s value when sold. This technology is reminiscent of fractional investment platforms like BRICKX and DomaCom.
The latest figures released by the Australian Bureau of Statistics (ABS) shows that Australia’s population grew by 1.6% to 25.3 million people during the year ending 31 March 2019.
Queensland recorded the highest net interstate migration gain with 23,300 people, followed by Victoria and Tasmania. Meanwhile, New South Wales recorded the highest net interstate migration loss at 22,000 people, followed by Western Australia, the Northern Territory and South Australia.
Overall, all states and territories recorded positive population growth, except the Northern Territory which recorded a 0.4% decline. Victoria recorded the highest growth rate at 2.1%, followed by Queensland, the Australian Capital Territory, New South Wales, Tasmania, Western Australia and South Australia.
Hopefully you enjoyed this September Property Market Update. Be sure to subscribe to our Monthly Insider below to receive email updates.
You might also be interested in the August Property Market Update, July Property Market Update and The Ultimate Guide to Leasing in a Slow Market.
Did we miss anything in this September Property Market Update? Email us at [email protected] to let us know.