May 3rd, 2020
April property market update (2020)
Industry News
Industry News
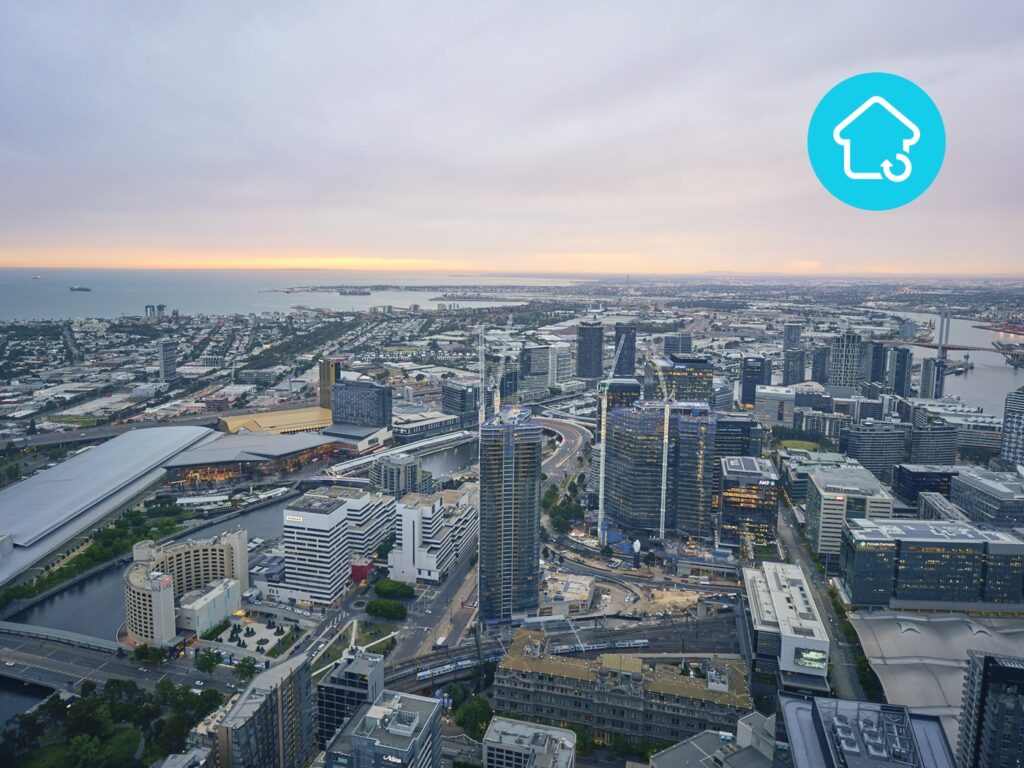
In May, the national vacancy rate jumped to 2.6% with CBD and holiday localities hardest hit, the unemployment rate rose to 6.2% and auction clearance rates continued to strengthen.
Without further ado, let’s dive into this month’s May property market update.
For the week ending 26 May 2020, the national asking price decreased by 0.4% for houses and 0.2% for units, compared to the week prior. Most capital cities recorded mixed results while Sydney and Melbourne recorded decreases and Brisbane recorded an increase for both houses and units.
Month on month, the national asking price fell by 0.2% for houses and 0.4% for units. Across capital cities, house prices rose by 0.5% while unit prices held steady. Notably, Melbourne, Perth and Adelaide recorded price increases across the board while Canberra and Hobart recorded price decreases.
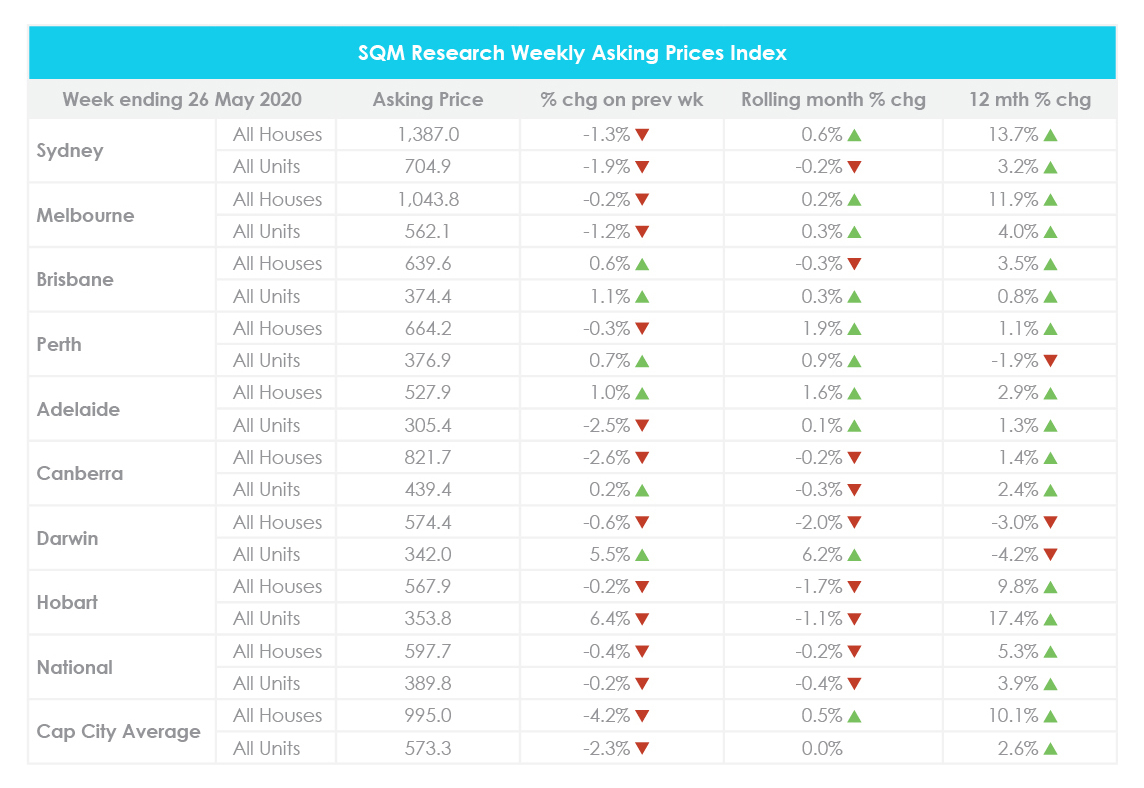
Year on year, this reflects a 5.3% increase in house prices nationwide and a 3.9% increase in unit prices nationwide. Across capital cities, this reflects a 10.1% increase in house prices and a 2.6% increase in unit prices. Further price breakdowns can be found here.
Additionally, SQM Research figures show that national residential property listings increased by 3.9% from 292,775 listings in April to 304,137 listings in May. However, this is 12% lower than the number of listings recorded in May last year.
Furthermore, according to Commonwealth Bank of Australia (CBA) modelling, property prices could fall between 11% and 32% by the end of 2022, depending on severity of the economic downturn and the growth of unemployment during the pandemic.
CBA Chief Executive Matt Comyn told The Sydney Morning Herald that downward pressure on property prices is expected. However, low levels of stock would prevent a sharp drop in house prices in the short term.
For the week ending 28 May 2020, the average weekly rent across Australia increased by 1% to $441 for houses and decreased by 1% to $369 for units, compared to the week prior.
Month on month, the national weekly rents rose by 0.5% for houses and 0.3% for units. Sydney, Melbourne, Perth and Hobart recorded overall declines in weekly rents while Brisbane and Adelaide recorded overall increases.
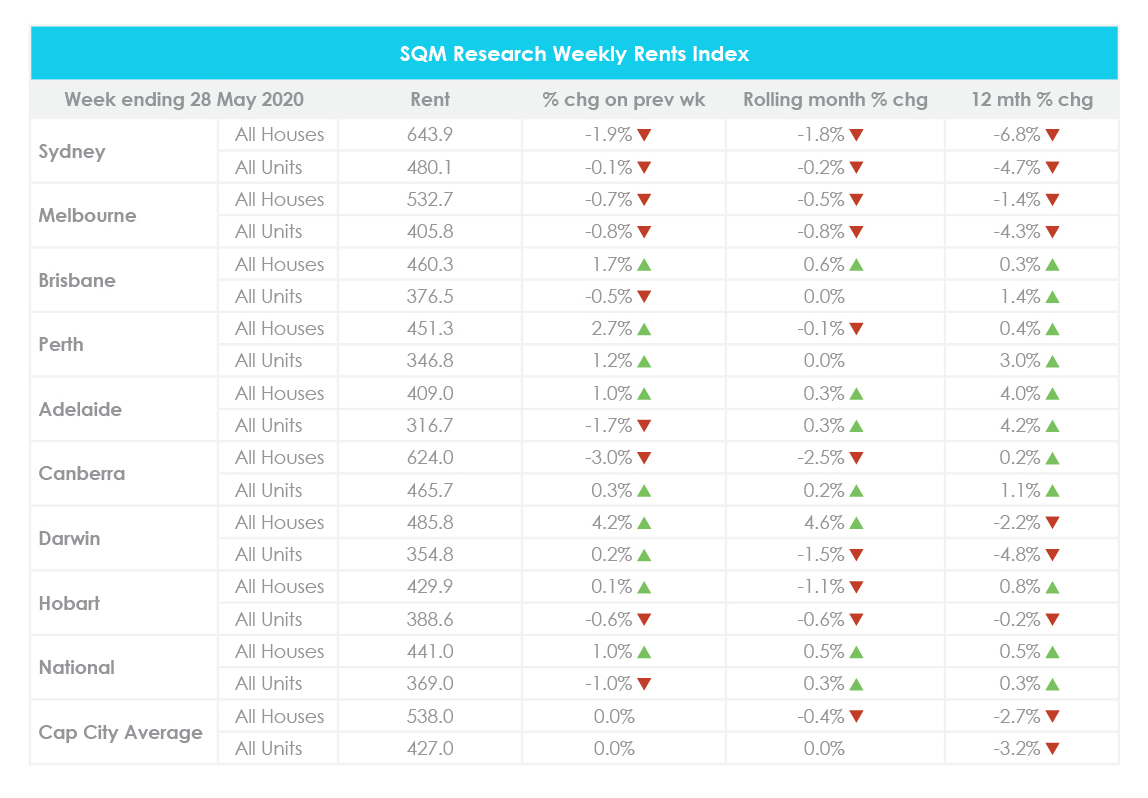
Year on year, national weekly rents have increased by 0.5% for houses and 0.3% for units. Meanwhile, capital city weekly rents have decreased by 2.7% for houses and by 3.2% for units. Further price breakdowns can be found here.
SQM Research Managing Director Louis Christopher said that this was “the biggest renters’ market” he has seen in his 20-year career.
According to Mr Christopher, “from what we can see in the data, it’s actually been the upper end of the market that’s been hit the hardest.”
He also remarked that the “falls were precipitated by a huge number of migrants leaving the country, young people returning home to live with their parents and former Airbnb rentals being let long term.”
SQM Research recorded a surge in rental stock from late March, which continued throughout April and May. As a result, the national residential vacancy rate jumped 0.6% from 2% in March to 2.6% in April. Now there are 88,668 residential properties sitting vacant Australia-wide.
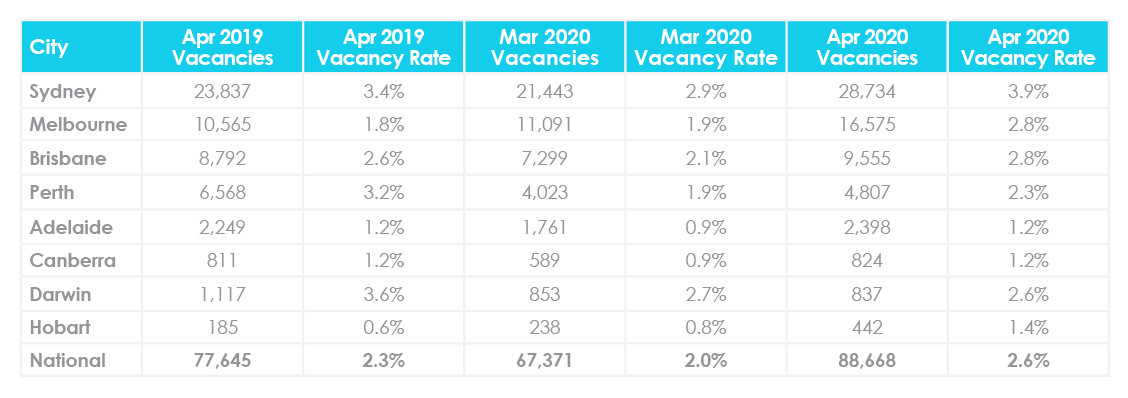
Almost all capital cities recorded increases in vacancy rates compared to the month prior, with the exception of Darwin which recorded a 0.1% decrease.
Year on year, the national residential vacancy rate is 0.3% higher than the 2.3% recorded in April 2019. Additionally, most capital cities recorded a higher vacancy rate compared to the same time last year. Only Perth and Darwin recorded lower vacancy rates. Further vacancy rate breakdowns can be found here.
Holiday hotspots and CBD localities have been hardest hit—Sydney CBD vacancy rates skyrocketed to 13.8%, Melbourne CBD vacancy rates rose to 7.6% and holiday locations in Queensland recorded vacancy rates of 8.5% (Surfers Paradise) and 6.8% (Noosa).
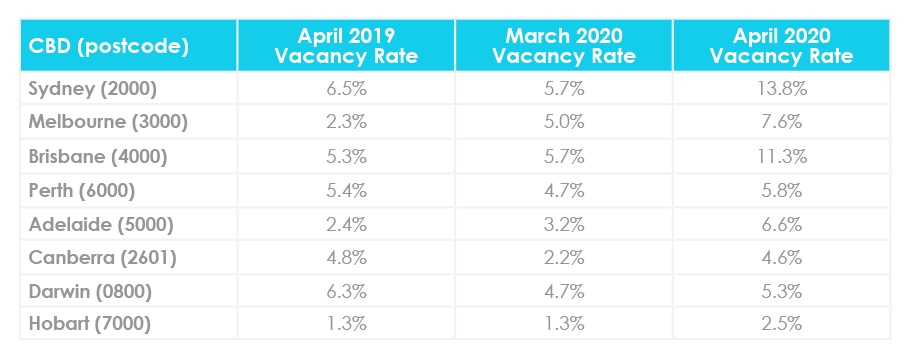
SQM Research Managing Director Louis Christopher remarked, “This is one of the largest one month rises ever recorded on our vacancy rates series. The blow out in rental vacancy rates for the major CBDs suggests a mass exodus of tenants occurred over the course of March and April. This might be attributed to the significant loss in employment in our CBDs plus the drop off in international students. We are well aware of a surge in short term accommodation now being advertised for long term leasing.”
“The question now begs is how long will we see such high rental vacancies? If it is sustained throughout the course of the year, then we can expect far deeper falls in rents which will be good news for tenants but a disaster for landlords. There will also be economic consequences with further sharp falls in building approvals likely; thereby risking a major depression in our residential construction sector as well as the rather obvious risks for housing prices.”
With restrictions easing across most states and territories, public open homes and on-site auctions have resumed and auction clearance rates have continued to strengthen week on week.
For the week ending 31 May 2020, there were 867 homes scheduled for auction across capital cities, returning a preliminary clearance rate of 65.9%. While this is higher than the 58% clearance rate recorded a year ago, volumes are much lower. Nevertheless, volumes are the highest it has been since the week ending 19 April 2020.
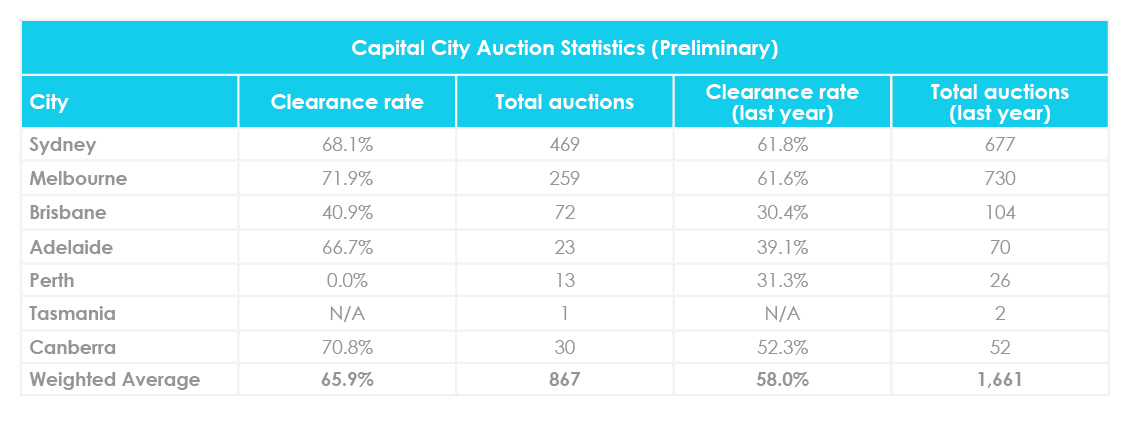
Across capital cities, Melbourne recorded the highest clearance rate at 71.9%. This was followed by Canberra at 70.8% then Sydney at 68.1%. In contrast, Perth recorded the lowest clearance rate at 0%. For further auction clearance rate information across each capital city, click here.
The Reserve Bank of Australia (RBA) has kept the cash rate unchanged at 0.25% after their June meeting.
RBA Governor Philip Lowe said, “The global economy is experiencing a severe downturn as countries seek to contain the coronavirus. Many people have lost their jobs and there has been a sharp rise in unemployment. Over the past month, infection rates have declined in many countries and there has been some easing of restrictions on activity. If this continues, a recovery in the global economy will get under way, supported by both the large fiscal packages and the significant easing in monetary policies.”
According to Dr Lowe, “The Australian economy is going through a very difficult period and is experiencing the biggest economic contraction since the 1930s.”
He noted that the total hours worked in April declined by an unprecedented 9%, more than 600,000 Australians lost their jobs and household spending had weakened considerably. As a result, the unemployment rate jumped to 6.2% nationwide.
However, there are signs that hours worked stabilised in early May and consumer spending has recovered slightly. Additionally, the unemployment rate is 3.8% lower than what the RBA had anticipated for June 2020.
“It is possible that the depth of the downturn will be less than earlier expected. The rate of new infections has declined significantly and some restrictions have been eased earlier than was previously thought likely,” Dr Lowe remarked.
New research conducted by the Property Investment Professionals of Australia (PIPA) analysed annual median house prices and index data for seven consecutive years at the start of each recession or downturn from 1973 to the Global Financial Crisis (GFC) which ended in 2008.
PIPA found that property prices increased by as much as 100% in the five years after the most recent recessions.
Five years after the 1973 to 1975 recession, Sydney median property prices increased by 100.7%. A few years later, following the 1982 to 1983 economic downturn, many capital cities saw property price growth between 50 to 64%. Furthermore, following the GFC, property prices boomed.
PIPA Chairman Peter Koulizos said, “In fact, looking back over the past nearly 50 years, house prices were higher five years after a recession or downturn each time.”
“The moral of the story is don’t panic. Property has shown its resilience through economic shocks before and we have no reason to expect it won’t do so again.”
Hopefully you enjoyed this May Property Market Update. Be sure to subscribe to our Monthly Insider below to receive email updates.
You might also be interested in:
Let us know your thoughts on this month’s May property market update by emailing [email protected].