
The uncertainty caused by the global coronavirus pandemic continued to reverberate through the Australian property market in April. There was a surge in rental stock nationwide, the RBA kept the cash rate unchanged at 0.25% and auction volumes took a dive over Anzac Day weekend.
Property prices
For the week ending 28 April 2020, the national asking price decreased by 0.6% for houses and increased by 1.9% for units, compared to the week prior. Most capital cities recorded mixed results while Sydney recorded a decrease and Melbourne recorded an increase for both houses and units.
Month on month, the national asking price rose by 0.4% for houses and 0.2% for units. Across capital cities, Melbourne, Canberra and Darwin recorded an overall increase while Hobart recorded a decrease in house and unit asking prices. Meanwhile, Adelaide asking prices remained unchanged.

Year on year, this reflects a 5.6% increase in house prices nationwide and a 3.8% increase in unit prices nationwide. Across capital cities, this reflects a 8.9% increase in house prices and a 2.4% increase in unit prices. Further price breakdowns can be found here.
Furthermore, SQM Research data from early April shows that national residential property listings increased by 3.7% in March from 296,770 listings in February to 307,847. In addition, there was a 74% increase in properties that have been on the market between 30 to 60 days which suggests that sales activity slowed during March.
Rental values
For the week ending 28 April 2020, the average weekly rent across Australia decreased by 2% to $439 for houses and increased by 2% to $368 for units, compared to the week prior. Across capital cities, Sydney, Melbourne and Perth recorded overall decreases in rental values while Adelaide recorded an overall increase.
Compared to the month prior, every capital city recorded an overall decline in weekly rents, with the exception of Adelaide where the weekly rent for units increased by 1.5%.
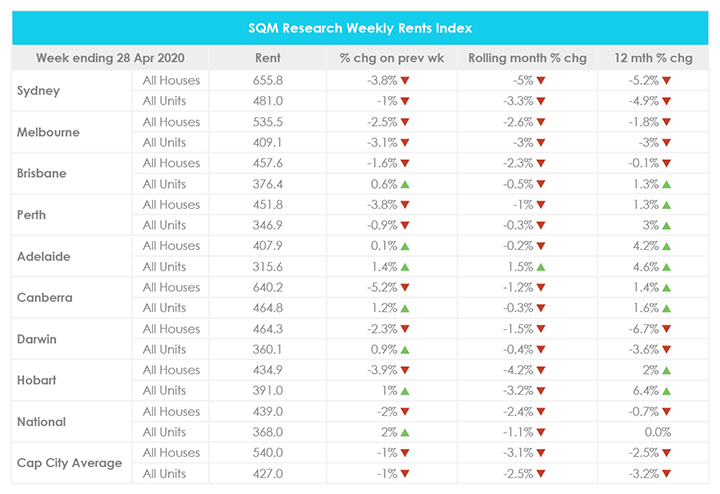
Year on year, national weekly rents have decreased by 0.7% for houses and held steady for units. Meanwhile, capital city weekly rents have decreased by 2.5% for houses and by 3.2% for units. Further price breakdowns can be found here.
This can be largely attributed to the surge in rental stock from late March, which has continued throughout April. According to SQM Research, on the 25th of March, there were 86,895 rental listings. However, on the 25th of April, rental listings increased to 105,284. This will most likely result in a jump in April vacancy rates.
Vacancy rates
The national vacancy rate has remained stable at 2% from February to March with 67,371 vacant residential properties Australia-wide. This is 0.1% lower than the vacancy rate recorded for March 2019.
Almost all capital cities recorded minor 0.1% decreases in vacancy rates compared to the month prior, with the exception of Sydney, Melbourne and Darwin where vacancy rates held steady.
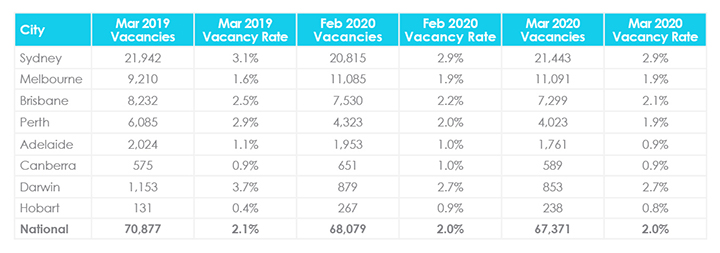
Year on year, only Melbourne and Hobart recorded higher vacancy rates. Further vacancy rate breakdowns can be found here.
SQM Research Managing Director Louis Christopher said “The minor decline in most capital cities’ vacancy rates for March was somewhat surprising given the uncertainty around the economy. With job losses, a freeze in migration and an expected sharp rise in short-term accommodation vacancies, we are likely to record significant increases in rental vacancy rates as 2020 progresses. Let’s keep in mind our methodology requires a property to be advertised for three weeks or longer before we regard it as unoccupied.
“We note the 3.2% drop in asking rents for houses over the month which may well be as a result of many short-term accommodation dwellings entering into the longer term leasing market, and overall, a sign of things to come.“
Auction clearance rates
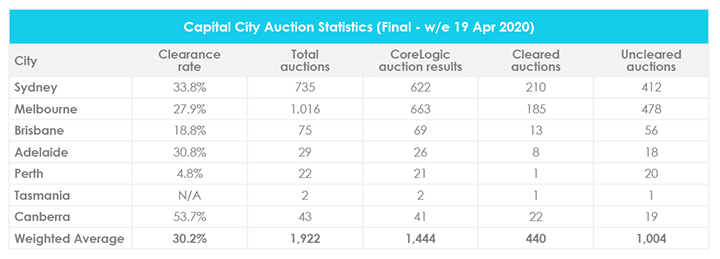
For the week ending 19 April 2020, there were 1,922 homes scheduled for auction across capital cities, with a final auction clearance rate of 30.2%. This is higher than the record low recorded by CoreLogic the week prior.
Note that almost 61% of the 440 properties cleared were sold prior to the scheduled auction date while 56% of the 1,444 auction results collected were withdrawn.
For the week ending 26 April 2020, auction volumes dipped due to Anzac Day falling on a Saturday. There were only 314 properties scheduled for auction across capital cities with 152 in Sydney, 89 in Melbourne, 30 in Brisbane, 25 in Canberra, 11 in Adelaide, 7 in Perth, 2 in the Northern Territory and none in Tasmania. For further auction clearance rate information across each capital city, click here.
SQM Research Managing Director Louis Christopher has been monitoring all scheduled auctions and “it is clear that those properties that have been re-advertised as a private treaty, have largely not sold.”
“Our opinion of the market as it currently sits is there has been a significant drop in buyer activity since Mid-March as the auction clearance rates accurately reveal. We hold to the view that pricing expectations have adjusted in the capital cities of Sydney, Melbourne and Brisbane by between 5-10% from their February highs. However, it is also fair to say that the market has not yet collapsed.”
“There was a surge in sellers in the lead up to the crisis. Many of them, no doubt trying to capture the February high of the market before things deteriorated. Most sellers didn’t make it in time. But since then, these sellers have not outright panicked just yet. And with the flagging of the easing of restrictions across the states, many of them will be hoping that buyer activity will pick up again shortly. “
Cash rate and predictions
The Reserve Bank of Australia (RBA) has kept the cash rate unchanged at 0.25% in April after making an out of cycle decision to cut the cash rate on the 19th of March in response to COVID-19.
RBA Governor Philip Lowe said “The coronavirus remains first and foremost a very major public health issue, but it is also having very significant effects on economies and financial systems around the world. Many countries are expected to experience large economic contractions as a consequence of the public health response. Large increases in unemployment are also expected.”
“The Board will not increase the cash rate target until progress is being made towards full employment and it is confident that inflation will be sustainably within the 2–3 per cent target band.”
According to Dr Lowe, “over the first half of 2020 we are likely to experience the biggest contraction in national output and income that we have witnessed since the 1930s.”
The RBA predicts that by June 2020:
- National output could fall by 10%
- Total hours worked in Australia might decline by 20%
- The unemployment rate could increase to 10%
“I am hopeful that it might be lower than this if businesses are able to retain their employees on lower hours. The unemployment rate would have been much higher than this without the government’s JobKeeper wage subsidy.”
The revenue impact of COVID-19
A recent study by Momentum Intelligence in April showed the revenue impact of COVID-19 across a range of professional services brands including accounting, aviation, defence, financial services, law, mortgage and finance broking and real estate.
According to the study, real estate businesses have been hit the hardest among those surveyed. While 52% of all business owners and managers surveyed said that their revenue to date has decreased, 67% of real estate business owners and managers surveyed said that their revenue has suffered.
Conversely, 15% of real estate business owner and manager respondents have seen no impact and 15% were unsure at the time of the survey.
Looking at business confidence over the next three months, 84% of real estate business owners and managers surveyed expect their revenue to be impacted further. Meanwhile, 10% were unsure, 3% expect no impact and 3% expect revenue to increase.
COVID-19 Australian property market dashboard
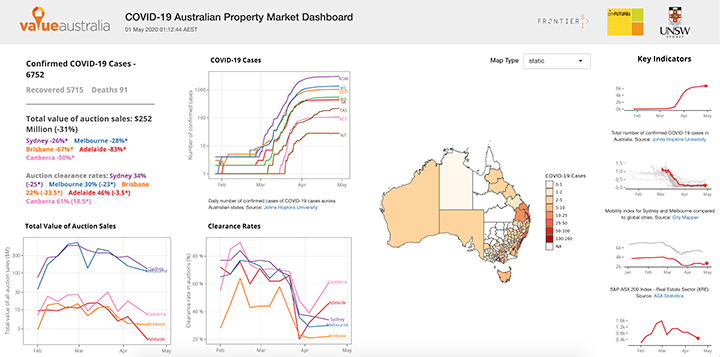
Researchers at the City Analytics Lab in the City Futures Research Centre at the University of New South Wales (UNSW) Built Environment have created a COVID-19 Australian Property Market Dashboard to assist Australians in monitoring and understanding the property market as the pandemic unfolds.
The interactive dashboard, which is updated daily, shows the number of COVID-19 cases Australia-wide, total value of auction sales, clearance rates, median price, the house value index, Twitter sentiment and a number of key indicators such as the performance of the S&P/ASX 200 Real Estate (XRE) sector and city mobility.
As of 1 May 2020, the total value of auction sales across Australia has decreased by 31% compared to the same period last year. Additionally, auction clearance rates have decreased across all major cities, except for Canberra.
Hopefully you enjoyed this April Property Market Update. Be sure to subscribe to our Monthly Insider below to receive email updates.
You might also be interested in March Property Market Update, February Property Market Update and Australian Property Investor Report 2020.
Let us know your thoughts on this month’s April property market update by emailing [email protected].