January 8th, 2020
December property market update (2019)
Industry News
Industry News

In January, weekly rents increased nationwide and across capital cities, the national vacancy rate rose to 2.5% and major Australian housing markets were deemed severely unaffordable in Demographia’s housing affordability survey.
Without further ado, here’s this month’s January property market update:
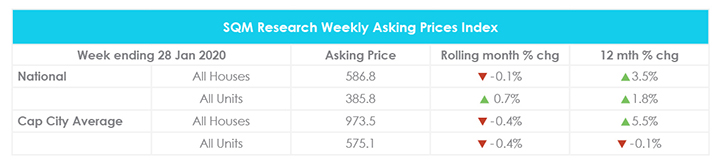
In January, the national asking price for houses decreased by 0.1% and increased by 0.7% for units. Across capital cities, both house and unit prices recorded an overall decline.
Year on year, this reflects a 3.5% increase in house prices nationwide and a 1.8% increase in unit prices nationwide. Across capital cities, this reflects a 5.5% increase in house prices and a 0.1% decrease in unit prices.
Melbourne, Brisbane, Adelaide and Hobart recorded increases in asking prices for both houses and units. Conversely, Sydney recorded a 0.6% decrease in house prices and a 0.7% decrease in unit prices compared to the month prior. Further price breakdowns can be found here.
For the week ending 28 January 2020, the average weekly rent across Australia increased by 0.4% to $452 for houses and by 3% to $374 for units. Meanwhile, the average weekly rent across capital cities rose by 1.4% to $562 for houses and by 1.1% to $441 for units.
Compared to the year prior, national weekly rents have increased by 0.7% for houses and by 1.9% for units. Meanwhile, capital city weekly rents are the same as they were a year ago.

Hobart still shows the strongest growth year on year with a 7.6% increase in weekly rents for houses and 18.2% increase in weekly rents for units. Further price breakdowns can be found here.
The national vacancy rate increased marginally from 2.2% in November to 2.5% in December, which is the same vacancy rate recorded for December 2018. There are now 84,591 properties sitting vacant Australia-wide, up from 75,947 properties in November.
Across capital cities, almost all capital cities recorded a marginal increase in vacancy rates, with the exception of Perth where vacancy rates held steady at 2.5% from November to December.
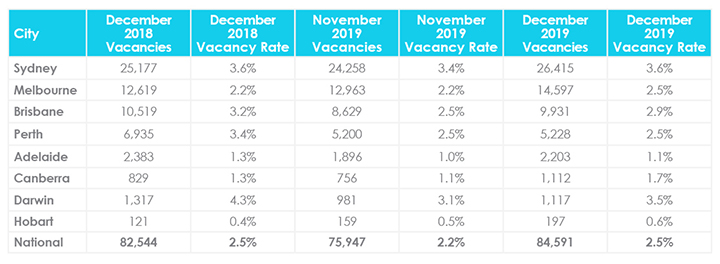
Sydney continues to record the highest vacancy rates nationwide at 3.6%, up from 3.4% in November. In contrast, Hobart continues to maintain the lowest vacancy rate nationwide at 0.6%, up from 0.5% in November. This is followed by Adelaide at 1.1% and Canberra at 1.7%. Further vacancy rate breakdowns can be found here.
SQM Research Managing Director Louis Christopher said “While vacancy rates did rise in December, this was predominantly due to the seasonal movement of students and some industry specific workers. It is actually quite likely we have reached the peak in national rental vacancy rates with ongoing strong population growth absorbing current surplus rental stock over 2020.”
According to the CoreLogic Quarterly Auction Review, for the three months to December 2019, the clearance rate came in at 70.3% for the combined capital cities, up from 69.9% the previous quarter. However, this is significantly higher than the 43.6% clearance rate recorded for the same period last year.
Sydney and Melbourne recorded the highest clearance rates at 74.9% and 72.8% respectively. This was followed by Canberra at 68%, Tasmania at 62.2%, Adelaide at 57.4% and Brisbane at 45%. Perth recorded the lowest clearance rate at 39.5% across 517 auctions.
Auction volumes were also significantly higher with 26,923 auctions in the December 2019 quarter, up from 16,730 auctions the previous quarter. Melbourne accounted for 12,870 auctions, followed by Sydney with 9,546 auctions and Brisbane with 1,615 auctions. In contrast, Tasmania recorded the lowest volume with 53 homes taken to auction.
CoreLogic Head of Residential Research Eliza Owen said, “As prices in Sydney and Melbourne rose 6.2% and 6.1% respectively in the December quarter, a corresponding increase in auction market activity is expected. Vendors have been responsive to higher prices, with auction volumes up by 4.0% year on year.”
Subsequent to the jobless rate hitting a nine-month low of 5.1%, the Reserve Bank of Australia (RBA) is expected to keep the cash rate unchanged at 0.75% in the coming months to see the full effects of the triple-rate cuts of 2019. After all, “a change in the level of short-term interest rates takes 12-18 months to have its full impact on the economy”.
This sentiment is echoed in a recent Reuters poll of 32 respondents—the RBA is expected to hold the cash rate at 0.75% in February. Meanwhile, 23 of 32 respondents predict that rates will fall to 0.5% before June and a median of 29 respondents expect rates to be held at 0.5% through the end of 2020.
Westpac Chief Economist Bill Evans said, “We expect that the RBA will lower its 2020 growth forecast” to account for the impact from the bushfires and coronavirus outbreak as China is Australia’s largest trading partner.
The annual Demographia International Housing Affordability Survey ranks 309 metropolitan housing markets in eight countries including Australia, Canada, China (Hong Kong only), Ireland, New Zealand, Singapore, the United Kingdom and the United States.
The housing markets are ranked by “median multiple”—median house price divided by median household income. The higher the median multiple, the less affordable the market is. Note that a median multiple of 5.1 and over is considered severely unaffordable.
Here are the five least affordable housing markets and their median multiples:
1. Hong Kong (20.8)
2. Vancouver (11.9)
3. Sydney (11)
4. Melbourne (9.5)
5. Los Angeles (9)
As shown above, Sydney and Melbourne are the third and fourth least affordable housing markets. Compared to the year prior, Sydney showed a slight improvement in affordability from a median multiple of 11.7 while Melbourne remained the same.
Meanwhile, the Gold Coast, Geelong, Hobart, Adelaide, Fraser Coast, Canberra, Brisbane, Perth and Ballarat all made the top 50 least affordable housing markets. In fact, the survey deemed all of Australia’s major housing markets to be severely unaffordable with a median multiple of 6.9, and the only affordable market in Australia was Gladstone, placing 281st on the list.
The latest figures released by the Australian Bureau of Statistics (ABS) show that Australia’s population grew by 1.5% to 25.36 million people for the year ended 30 June 2019. This is an increase of 75,600 people since 31 March 2019.
Positive population growth was recorded across all states and territories with the exception of the Northern Territory where the population declined by 0.5%, compared to the year prior. It was also noted that Victoria recorded the highest population growth rate at 2.1%, followed by Queensland at 1.7% and the Australian Capital Territory at 1.5%.
Hopefully you enjoyed this January Property Market Update. Be sure to subscribe to our Monthly Insider below to receive email updates.
You might also be interested in the December Property Market Update, November Property Market Update and The Ultimate Social Media Calendar for Australian Agents.
Did we miss anything in this January Property Market Update? Email us at [email protected] to let us know.