November 1st, 2019
October property market update (2019)
Industry News
Industry News

In November, property prices continued recovering, the cash rate was held at 0.75%, national vacancy rates remained unchanged and the latest rental affordability research found that Hobart is the least affordable capital city in Australia.
Without further ado, here’s this month’s November property market update:
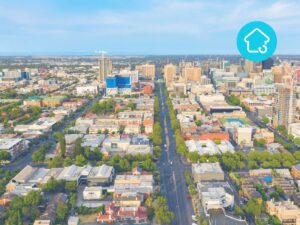
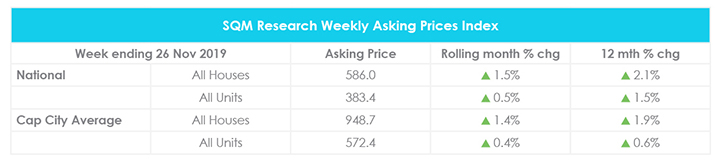
Compared to October, the national asking price increased by 1.5% for houses and 0.5% for units in November. Meanwhile, across capital cities, house prices increased by 1.4% and unit prices increased by 0.4%.
Sydney, Melbourne, Adelaide and Canberra all recorded a rise in property prices across the board. Melbourne showed the strongest signs of growth with a 2.7% increase for houses and a 1.2% increase for units. Conversely, Darwin’s house prices declined 1.7% for houses and 2% for units.
Year on year, this reflects an increase in property prices nationwide and across capital cities. Further price breakdowns can be found here.
Additionally, CoreLogic reported the largest month-on-month gain in their national home value index since May 2015. Following four months of positive growth from July to October, national dwelling values are up 2.9% since finding a floor in June 2019. However, values remain 5.7% below their peak three years ago.
This rapid turnaround can be attributed to three interest rate cuts, lower mortgage rates, easing of home lending criteria, reduced uncertainty and improved credit availability.
Property prices are expected to continue rising as buyer demand grows and sellers tentatively return to the market. According to HSBC Chief Australia and New Zealand Economist Paul Bloxham, national property prices are expected to rise by 5% to 9% in 2020.
For the week ending 28 November 2019, the average weekly rent for houses increased by 1.4% nationwide to $450 and remained unchanged at $367 for units. Meanwhile, the average weekly rent across capital cities rose by 1.7% to $554 for houses and remained unchanged at $435 for units.
Compared to the year prior, national weekly rents have increased by 0.9% for houses and 0.3% for units. In contrast, capital city weekly rents are 0.2% lower for houses and units.
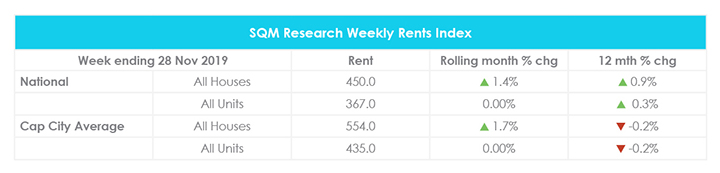
Hobart recorded the strongest growth with a 2.7% increase in weekly rents for houses and a 5% increase for units. Year on year, this reflects a 3.7% increase for houses and a 17% increase for units in Hobart. This was followed by Canberra with a 4.3% increase in weekly rents for houses and a 0.9% increase for units.
Interestingly, almost all capital city weekly rents are higher than they were a year ago, with the exception of Sydney and Darwin. Year on year, Sydney recorded a 3.6% decrease in weekly rents for houses and 2.5% decrease for units while Darwin recorded a 4.1% decrease for units. Further price breakdowns can be found here.
According to SQM Research, there were 69,951 properties sitting vacant Australia-wide in October, down from 71,404 properties in September. Despite the reduction in vacant properties, the national residential vacancy rate remained unchanged from September at 2.1%. However, this is 0.1% higher than the vacancy rate recorded in October last year.
Across capital cities, Sydney, Perth, Adelaide and Hobart all recorded a slight decline compared to the month prior. Meanwhile, vacancy rates increased in Darwin and remained steady in Melbourne, Brisbane and Canberra.
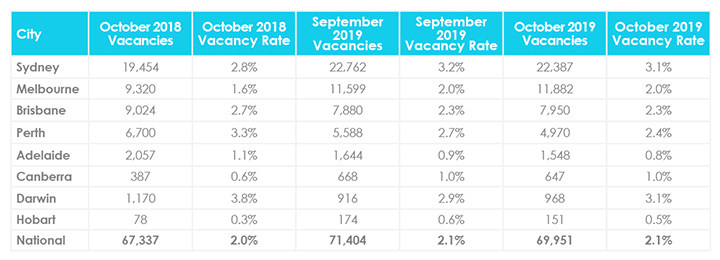
Sydney and Darwin recorded the highest vacancy rate in the country at 3.1%. Compared to the year prior, this is up from 2.8% for Sydney and down from 3.8% for Darwin. In contrast, Hobart continues to maintain the lowest vacancy rate nationwide at 0.5%, followed by Adelaide at 0.8%. Further vacancy rate breakdowns can be found here.
Managing Director of SQM Research Louis Christopher said “Residential property rental vacancy rates continue to remain largely steady for the month of October. Adelaide continues to record a recovering rental market.”
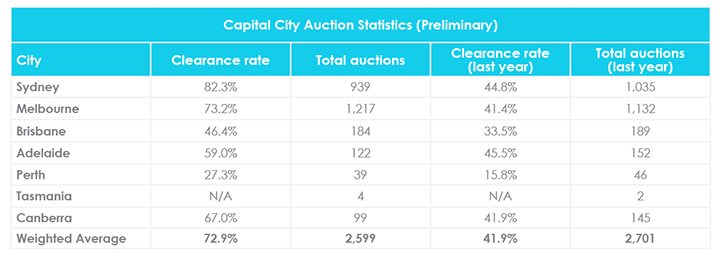
For the week ending 24 November 2019, 2,599 homes were taken to auction and 1,466 homes were cleared across combined capital cities, bringing the preliminary auction clearance rate to 72.9%. While this is down from last month’s preliminary auction clearance rate of 75.3%, it is well above last year’s clearance rate of 41.9%.
Overall, volumes are lower than the same period last year when 2,701 homes were taken to auction. Next week is predicted to be the biggest week of auctions held so far this year with a 14% surge in volumes expected.
Sydney yielded the highest preliminary auction clearance rate across the country at 82.3%, followed by Melbourne at 73.2%. For further auction clearance rate information across each capital city, click here.
Following three cuts of 25 basis points since June, the Reserve Bank of Australia (RBA) kept the cash rate unchanged at 0.75% as “the easing of monetary policy since June is supporting employment and income growth in Australia.”
In a recent speech, RBA Governor Phillip Lowe explored a number of unconventional monetary policies used overseas and said that “Our current thinking is that QE [quantitative easing] becomes an option to be considered at a cash rate of 0.25 per cent,” indicating that the central bank is prepared to lower cash rates by 50 basis points if necessary.
Subsequently, Westpac revised its cash rate forecast from 0.5% to 0.25% by June 2020 with Union Bank of Switzerland (UBS) economists echoing the same prediction. Back in September, the Australia and New Zealand (ANZ) Banking Group Head of Australian Economics David Plank predicted that the cash rate could drop to 0.25% by May 2020.
Despite the RBA failing to meet the inflation target of 2 to 3% for 20 successive quarters, Dr Lowe maintains that “Conventional monetary policy is still working in Australia and we see the evidence of this in the exchange rate, in asset prices and in the boost to aggregate household disposable income.”
According to new ANZ and CoreLogic research, housing affordability peaked in June 2019 following an 8.4% decrease in dwelling values from 2017. The last four months have seen capital city dwelling values begin to outpace household incomes again, with the exception of Perth and Darwin. At this rate, property prices are expected to reach record highs in the first half of 2020.
Similarly, the latest data from the Commonwealth Bank of Australia (CBA) Household Spending Intentions series shows that there has been a sharp increase in home buying intentions in September and October. CBA Chief Economist Michael Blythe said “The sharp upswing in home buying intentions continues and intentions are now approaching the record highs seen in early 2017.”
The latest Rental Affordability Index (RAI) found that Hobart is the least affordable capital city in Australia with rental affordability dropping to a critical level in June 2019. This means that the average household in Hobart is paying 30 to 38% of their income on rent, which would put them under rental stress.
This is followed by Adelaide and Sydney as the second and third least affordable capital cities. While Hobart and Sydney have had similar levels of rental affordability in the past, the gap has widened in the last two years due to increasing incomes and static rents in Sydney and lack of new supply in Hobart.
In contrast, Melbourne, Canberra, Brisbane and Perth have acceptable rental affordability levels. This means that the average household is paying 20 to 25% of their income on rent. While rental affordability continues to improve in Brisbane, Canberra experienced a steep decline in rental affordability and Perth remains the most affordable capital city in Australia.
Hopefully you enjoyed this November Property Market Update. Be sure to subscribe to our Monthly Insider below to receive email updates.
You might also be interested in the October Property Market Update, September Property Market Update and Top 10 Questions to Ask Potential Tenants.
Did we miss anything in this November Property Market Update? Email us at [email protected] to let us know.