The Australian real estate market is dynamic and challenging; for the real estate agents and property management professionals that work within it, it’s a place where success must be earned. Knowledge is power, and for many that knowledge is best delivered via the medium real estate statistics.
Today we’ll take a look at 50 of the most important, insightful and interesting real estate statistics — the type that allow you to gain a deeper understanding of the market, and help you to get ahead of your competitors in the industry.
Australian property market statistics
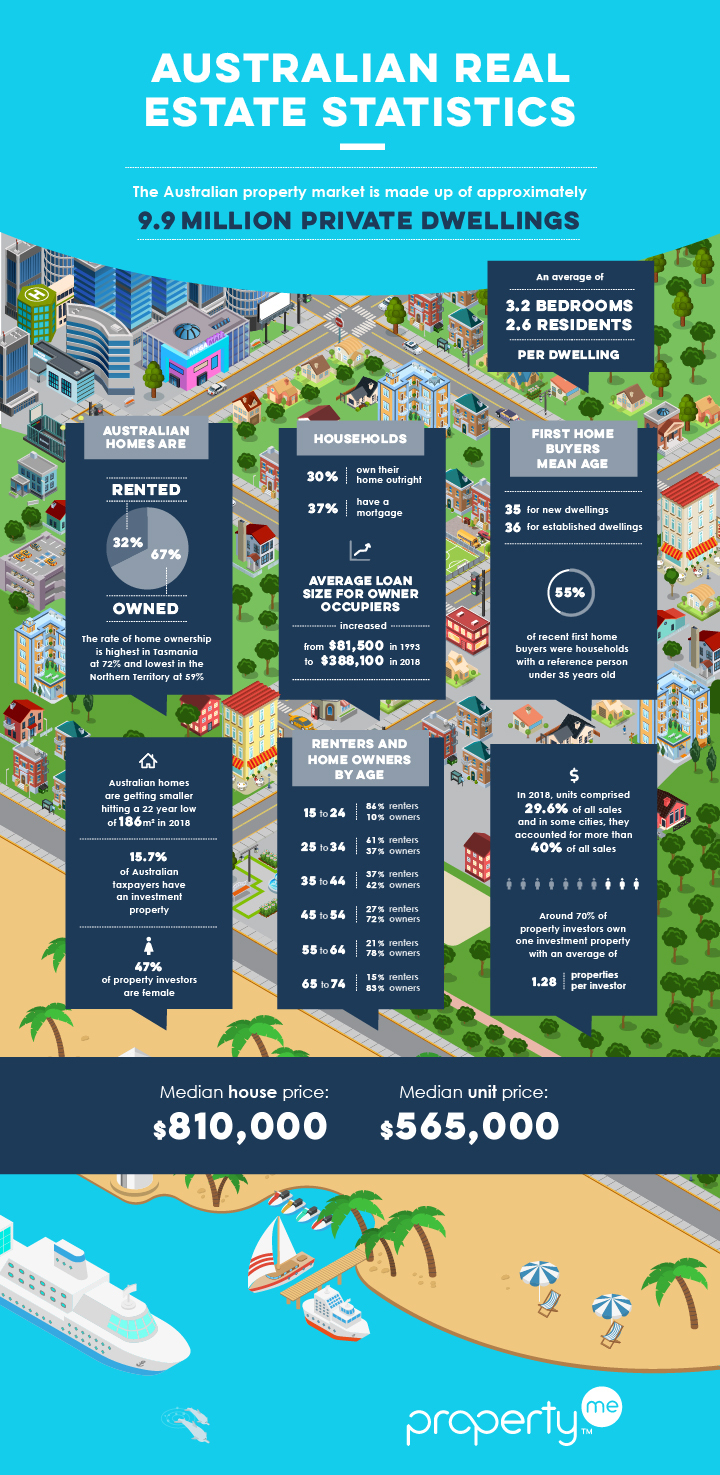
The Australian property market is made up of approximately 9.9 million private dwellings, with an average of 2.6 residents and 1.8 motor vehicles per dwelling (ABS, 2016)
The average number of bedrooms per dwelling is 3.2 (ABS, 2019)
The median monthly mortgage repayment is $1,755 and the median weekly rent is $335 (ABS, 2016)
As of mid-2019, the fastest growing capital cities by annual population increase were Melbourne at 2.3% and Brisbane at 2.1%, while Darwin at -0.8% was the only capital to have a net reduction (ABS, 2020)
Australian homes are getting smaller, hitting a 22 year low of 186m² in 2018, from a record high of almost 220m² in 2009, although they are still the second-largest in the world, after the US (Commsec, 2018)
More buyers are choosing to purchase a unit over a detached house due to cost and location. In 1993, only 22.7% of all dwelling sales nationally were for units. In 2018, units comprised 29.6% of all sales and in some cities, they accounted for more than 40% of all sales (Aussie, 2018)
In 2016, there were 1,214,372 occupied apartments and 6,343,419 occupied separate houses. Compared to 1991 figures, the number of occupied apartments (including flats and units, excluding townhouses) increased by 78% (ABS, 2017)
47% of the 1,214,372 occupied apartments are located in New South Wales, while 23% are located in Victoria and 17% in Queensland (ABS, 2017)
Australian home ownership and renter statistics
67% of Australian homes are owner-occupied, while 32% are rented (AIHW, 2020)
In 2017-18, 32% of Australian households rented their home from all landlord types, 27% from a private landlord and 3% from a state or territory housing authority (ABS, 2019)
Tasmania has the highest rate of home ownership at 72% and lowest rate of renters at 26%, and Northern Territory the opposite at 59% ownership, 39% renters (savings.com.au, 2019)
Compared to 1997-98, there has been a decline in households that own their home outright (30%, down from 40%) and an increase in households that have a mortgage (37%, up from 31%) (ABS, 2019)
The average loan size for owner occupiers increased from $81,500 in 1993 to $388,100 in 2018 (Aussie, 2018)
The overall rate of home ownership is projected to decline to approximately 63% by 2040 (AFR, 2020)
Australian first home buyer statistics
55% of recent first home buyers were households with a reference person under 35 years old (ABS, 2019)
The mean age of first home buyers has increased. In 1995-96, the mean age was 33 for either a new or established dwelling, but this has now increased to 35 for a new dwelling and 36 for an established dwelling (AHURI, 2019)
Australian property investment statistics
15.7% of Australian taxpayers own an investment property (PropertyMe, 2020)
Around 70% of property investors own one investment property, with an average of 1.28 properties per investor (CoreLogic, 2016)
19% of investors own two properties, and under 10% own three or more (ATO, 2017)
47% of property investors are now female, up 20% on last decade (PropertyMe, 2020)
In the 25 years between 1993 and 2018, Australia’s average house price rose 412%, far exceeding inflation (86%) over the same period. Melbourne had the largest increase in property values within a capital city, followed by Sydney and Perth (Aussie, 2018)
At the beginning of 2020, the median house price in Australia was $810,000, and the median unit price was $565,000 (Domain, 2020)
Across Australia, Victoria has the highest proportion of investment owned dwellings by state at 30.5%. This is followed by Queensland at 28.5% and New South Wales at 26.3% (CoreLogic, 2016)
Australian housing affordability statistics
Australia’s housing prices have risen while household incomes have fallen behind. In 1990, households on average valued their homes at a multiple of four times their average household income. By 2011, this climbed to nearly six times the average household income (The Conversation, 2015)
In 2017-18, Australian households spent an average of $311 on weekly housing costs. However, this varies for different tenure types: Owners without a mortgage spent $53 on weekly housing costs, owners with a mortgage spent $484 and renters spent $366 (ABS, 2019)
The average weekly housing costs for households varies across different states and territories. It is highest in the Northern Territory ($394) and lowest in Tasmania ($207) (ABS, 2019)
Australian real estate marketing statistics
Jellis Craig Real Estate found that marketing a property with a video resulted in a 403% increase in enquiries (Property Observer, 2012)
The “About” page is one of the top three most visited pages on a real estate agency’s site (Carrot, 2018)
The average Australian spends one hour and 39 minutes on social media every day (Hootsuite & We Are Social, 2018)
Australia has the highest click through rate (CTR) for Facebook ads in the world (Salesforce, 2016)
In 2019, realestate.com.au had 8.7 million unique visitors, or approximately one in every three Australians, and 60% of these visitors used the site exclusively (realestate.com.au, 2019)
The real estate industry employs around 120,000 people, 65,000 of which are business brokers, property managers, principals, real estate agents and representatives (REIA, 2011)
The average Australian real estate agent earns a salary of $48,000, plus bonuses and commissions worth $28,000 (PayScale, 2020)
Gold Coast real estate agents earn 14% more than the national average, while Adelaide real estate agents earn 20% less (PayScale, 2020)
Real estate agencies generated an estimated $2.8 billion in revenue in 2018 (Statista, 2020)
Ray White Group is the largest player in Australia’s real estate market, although no single company holds a market share of more than 5% (IBISworld, 2019)
68% of people would recommend their agent to friends or family (CoreLogic, 2015)
Australian property management statistics
Approximately 41,000 people work in property management in Australia (IBISworld, 2020)
The average full-time property manager works 43 hours per week (joboutlook.gov.au, 2016)
75% of Australian property managers work full-time (joboutlook.gov.au, 2016)
The median salary for an Australian property manager is $51,000, plus $11,000 in bonuses, commissions and profit-sharing arrangements (PayScale, 2020)
67% of Australian property managers are female (joboutlook.gov.au, 2016)
54% of Australian properties are managed by a property manager (REIA, 2015)
Renters significantly outnumber homeowners in the 15 to 24 (86% renters) and 25 to 34 (61% renters) age brackets, then drops significantly for the 35 to 44 (37% renters) age bracket (savings.com.au, 2019)
Residential property leasing and management industry revenue is expected to reach $5.5 billion in 2020 (IBISworld, 2020)
89% of property managers said floor plans and videos weren’t a priority inclusion in their listings (rent.com.au, 2016)
83% of property management departments’ enquiries come in via email, followed by phone (11.11%) and walk-ins (5.56%) (rent.com.au, 2016)
64% of property managers list communication as a key focus going forward (rent.com.au, 2016)
Australian real estate statistics infographic
Thanks for reading this blog on Australian real estate statistics! You might also be interested in: