The latest research reveals vacancy rights are tightening even further across Australia. Experts suggest this will lead to significant ramifications for headline inflation. Additionally, rental prices continue to grow across most cities, while house prices are beginning to decline slightly compared to the previous month.
Vacancy rates
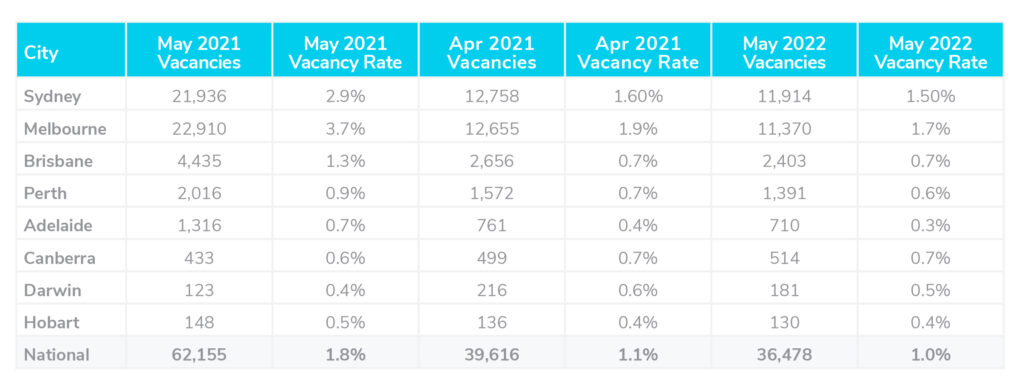
The most recently available vacancy rate data reveals a significant drop in vacancies over the past year. Between May 2021 and May 2022, vacancy rates across Australia have dropped from 1.8% to 1.1%. Additionally, over the previous month, between April and May, vacancy rates dropped from 1.1% to 1% Australia-wide. The number of vacancies was recorded as 36,478 last month. In comparison, 62,155 were recorded across the nation at the same time last year. The lowest vacancy rate was recorded in Adelaide at 0.3%. Hobart, Darwin and Perth followed closely with vacancy rates sitting at 0.4%, 0.5% and 0.6% respectively.
Louis Christopher, Managing Director of SQM Research said, “Rental vacancy rates continued to tighten across the country and there is nothing yet in the data that would suggest we are about to see a reprieve.” He continued, “Reductions in household size, short-term stay listings eating into longer-term lease availability and now the likely rise in immigration levels, are all factors contributing to this crisis. There will also be ramifications for headline inflation once the Australian Bureau of Statistics update their rental series with the actual market.”

Rental values
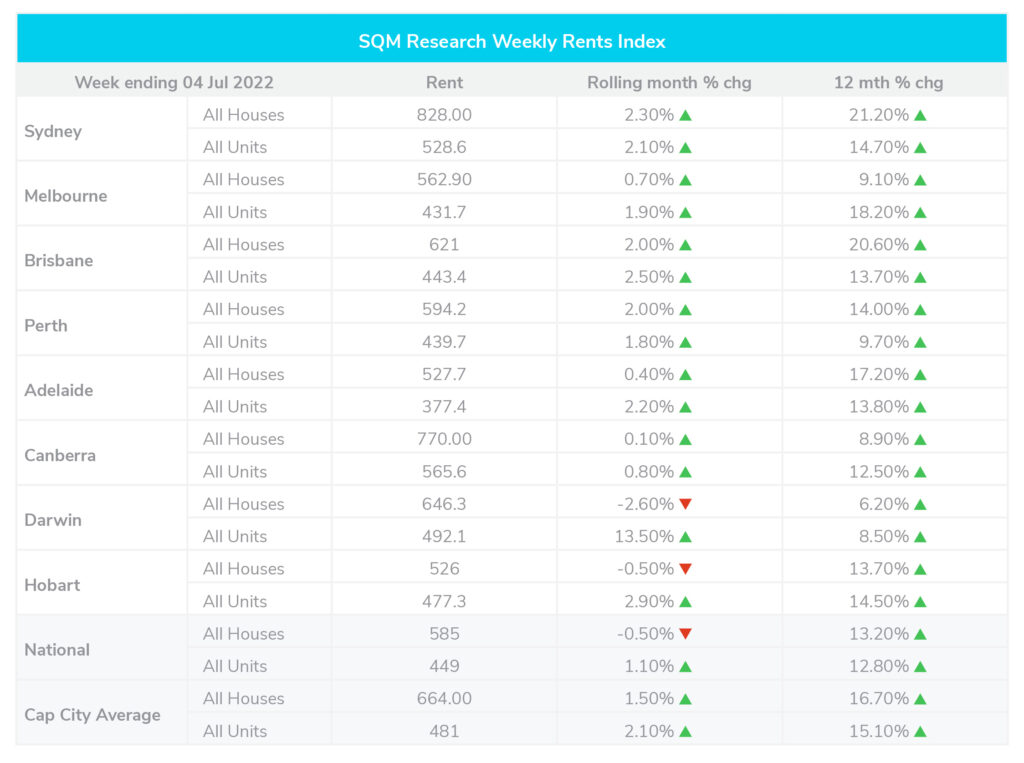
Over the past month till July 4th, rental values continued to grow across the majority of Australia’s cities for both homes and units–reflecting the tightened vacancy rate. For houses, there was a slight drop over the month nationwide, with a 0.5% decrease in rental values. However, compared to the same time last year, houses have seen an increase of 13.2% in rental values. On the other hand, units have seen an increase of 1.1% over the month and a 12.8% increase over the past year.
In Darwin, unit values skyrocketed. Growing by 13.5% for units. However, homes saw a 2.6% drop over the month. Sydney saw an increase for both homes and units in June at 2.3% and 2.1% respectively. While Melbourne saw a slight increase for homes and units at 0.7% and 1.9% respectively.
Louis Christopher, Managing Director of SQM Research highlighted, “Sydney combined rents have risen by 17.5% just over the past 12 months. Brisbane is up by 18.6% for the same period. Melbourne up by 14.8%.”

Property prices
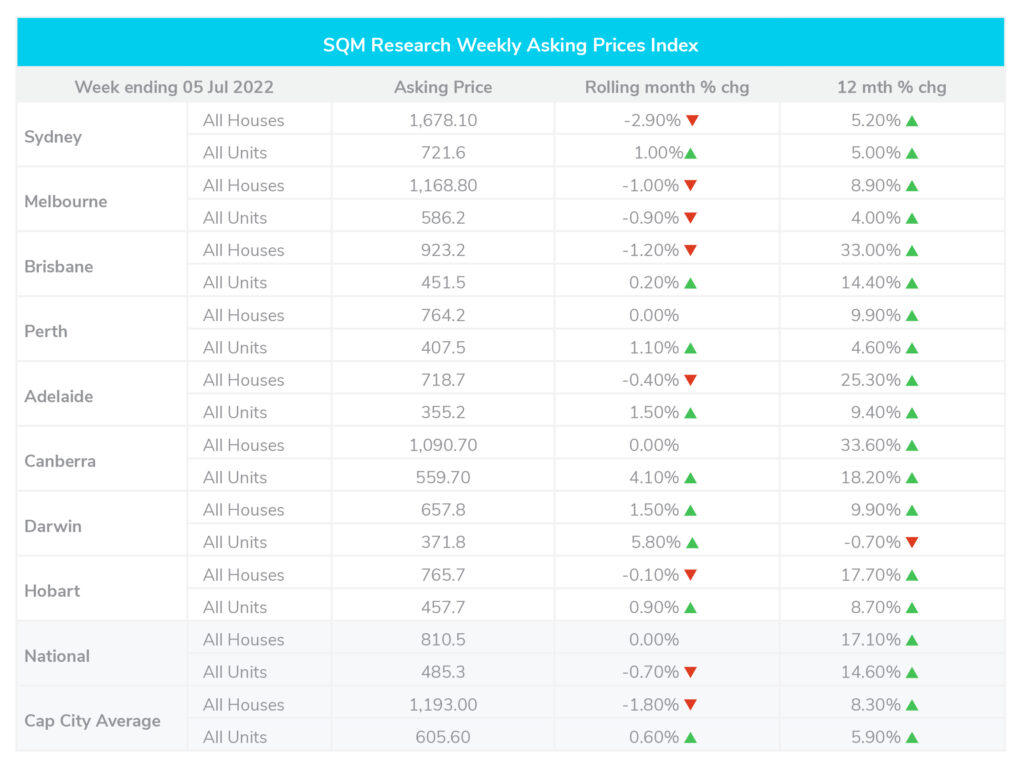
Over the month till the 5th of July, asking prices across Australia remained unchanged for homes and dropped by 0.7% for units. The greatest drop over the month was seen in Sydney where homes dropped by 2.9%. This was followed by Brisbane and Melbourne, where home prices dropped by 1.2% and 1% respectively.
However, compared to the same time last year, both homes and units nationwide have grown by 17.1% and 14.6%. Additionally, distressed property listings increased by 4.5% over the month of June. This occurs when a property must be sold quickly due to a variety of reasons.
Louis Christopher, Managing Director of SQM Research said, “Overall stock on market fell for the month largely due to the decline in new listings. The fall in new listings was a result of reduced vendor confidence in the strength of the housing market as well as seasonal factors whereby the winter period normally records a decline in residential property sales activity, particularly for Sydney and Melbourne. However, older listings rose. This reveals the slowdown in the housing market driven by lower buyer demand.”

Cash rate and predictions
The RBA has raised the interest rate further to 1.35%. This highlights one of the sharpest increases in rates since the early 90s.

